
Coverage Time Expert System Tool for Medical Distribution Centres of the Non-Governmental Organization (NGO).
by Samah el Sayed Mohamad
General description
Stockouts and supply chain management go hand in hand. Even though logically speaking a good supply chain management process would limit and minimize stockouts, this is not always the case. Sometimes the supply chain process is holistic, but the occurrence of a stockout is still noticed, implying a problem somewhere along the way. This is very critical, both in the humanitarian and the private sectors, given the impact stockouts have on the success or failure of businesses/services. Several studies have been conducted, but very few of them tackled this issue within the humanitarian framework, where, stockouts have detrimental effects both on the lives of the people receiving the service and the image of the organization delivering it, and thus the maintenance of a high service level is a non-variable requirement.
The study aims to conduct a global analysis of the stock out at different medical distribution centers of the NGO using the current monitoring tool, and then to develop an efficient tool for the diagnosis of the reasons of stockouts for each out of stock item in the NGO’s medical distribution centers. The new tool is developed in Tableau (BI application) aiming at better serving the NGO needs’ in identifying the causes of stockouts and taking the correct measures to limit them.
Methodology
A global statistical analysis of the NGO medical stocks during 2015 at six medical distribution centers is conducted. This analysis was based on the collection and study of seventy-two Medical Logistics Field Dashboards from these six centers. These dashboards, formed of eleven metrics, are the current tool used for monitoring the medical logistics performance. Correlations between stockout rate and replenishment lead time (number of weeks for receiving 98% of line items ordered from upstream), demand variability (percentage of items with a CoV >1), coverage time global (number of months customers can be supplied from current stock, provided average demand does not change), and loss of stock are calculated.
Since the Medical Logistics Field Dashboard is not intended to analyze the reasons of stockout per item, a Coverage Time Expert System tool is developed in Tableau based on an analytical flowchart.
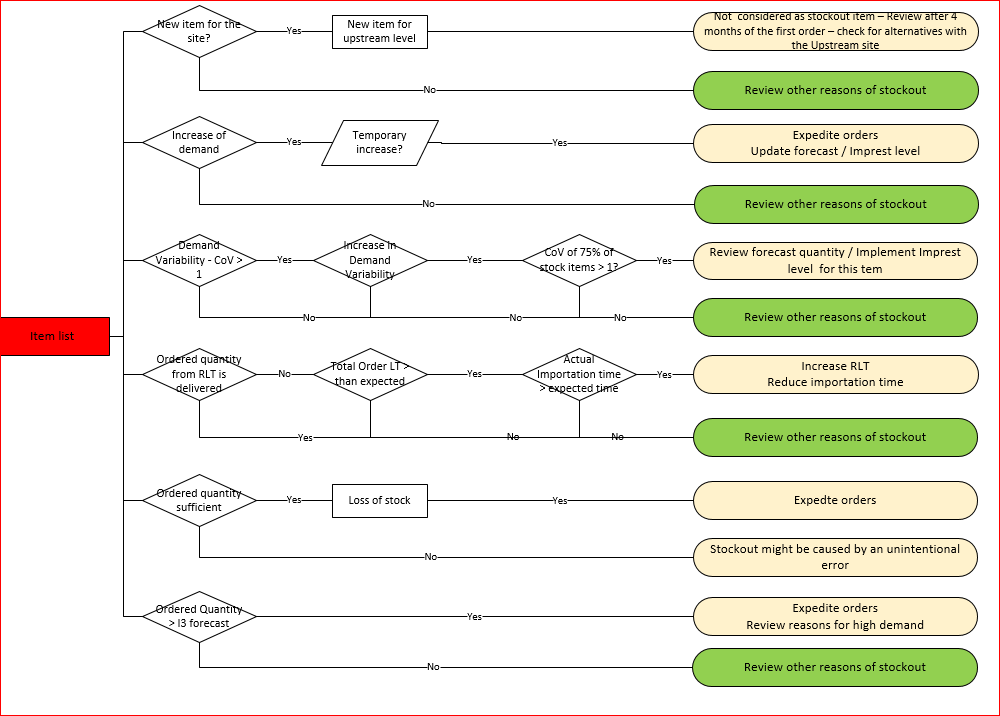
The flowchart contains thirteen metrics, capable of explaining the reasons behind an out of stock item.
This allows the medical logistician to determine the appropriate action to be taken to prevent or at least minimize the occurrence of stockouts.
The applicability of the tool is tested in three sites: the NGO’s NNN Regional logistics center, the NGO’s GGG distribution center, and the BBB distribution center.
Findings
The global statistical analysis based on the Medical Logistics Field Dashboards gives results that differed from literature and assumptions since they show:
1) Very weak correlation between stockout rates and RLTs, as well as stockout rates and demand variability (R2 equal to 0.13 and 0.27 respectively).
2) No correlation between stockout rates and coverage time, as well as stockout rates and loss of stock (R2 equal to 0.004 and 0.01 respectively)
3) Better correlation for two factors (RLT and demand variability) – R2 is equal 0.4 but nevertheless remains low.
The weak or absence of correlation between stockouts and the above metrics is one of the reasons why the new tool is developed. In fact, the Medical Logistics Field dashboard analyses the data at the site level and not item level. The results could be affected by several factors, such as but not limited to, the type of items (controlled drug), the packaging, the fact of adding new items to the national stock item list, local purchases, the value of dead stock in the medical distribution centre, and the value of claim reports compared to the quantity of items lost.
The Coverage Time Expert System tool is able to identify all the stockout items and the stock items not available to promise per Branch/Plant, and the reasons behind that. The tool was tested in three countries and the results for the thirteen metrics between the “in stock” items and “out of stock” were compared in order to verify that the chosen metrics have an impact on stockout.
The results of the testing are summarized below:
- All the stockout items and items not available to promise had at least one reason to be out of stock, so the tool is considered covering all the causes of a stockout.
- 13%, 6% and 25% of stockout items for GGG, NNN and BBB respectively have all the thirteen causes to be out of stock, which point to the fact that reasons for stockout often are multifactorial.
- Increase in demand, demand variability, order RLT delivered, quantity forecasted insufficient, are causes for stockouts since the percentage of items for these metrics is higher for items not available to promise than items in stock.
- The difference of the total order lead time between items not available to promise and items in stock was not conclusive, which confirms that the total LT of all items is not the appropriate metric to evaluate the RLT. Instead, measuring if there is any ordered quantity for the concerned item that is pending for more than the set RLT should be more accurate.
Conclusion and recommendations
The Coverage Time Expert System Tool is new; it is very promising and will be an added value for all NGO medical logisticians. It will help in having a concrete identification of stockout causes and planning relevant, efficient ways of avoiding or minimizing them.
Even though it now offers good results, several improvements can be applied in order to enhance the analysis and make it more comprehensive , such as: a multi-regression analysis to study the correlation between stockout and the thirteen metrics studied, a complete analysis for the overstocked items, an RLT that can be changed by the user, a possibility of knowing if the item is a controlled drug, an option of knowing the exact date of when an item became out of stock, and to actually keep a history of the stockout rate per Branch/plant.
If you want to learn more from this executive summary, send us an email to mashlm@usi.ch requesting the full thesis.